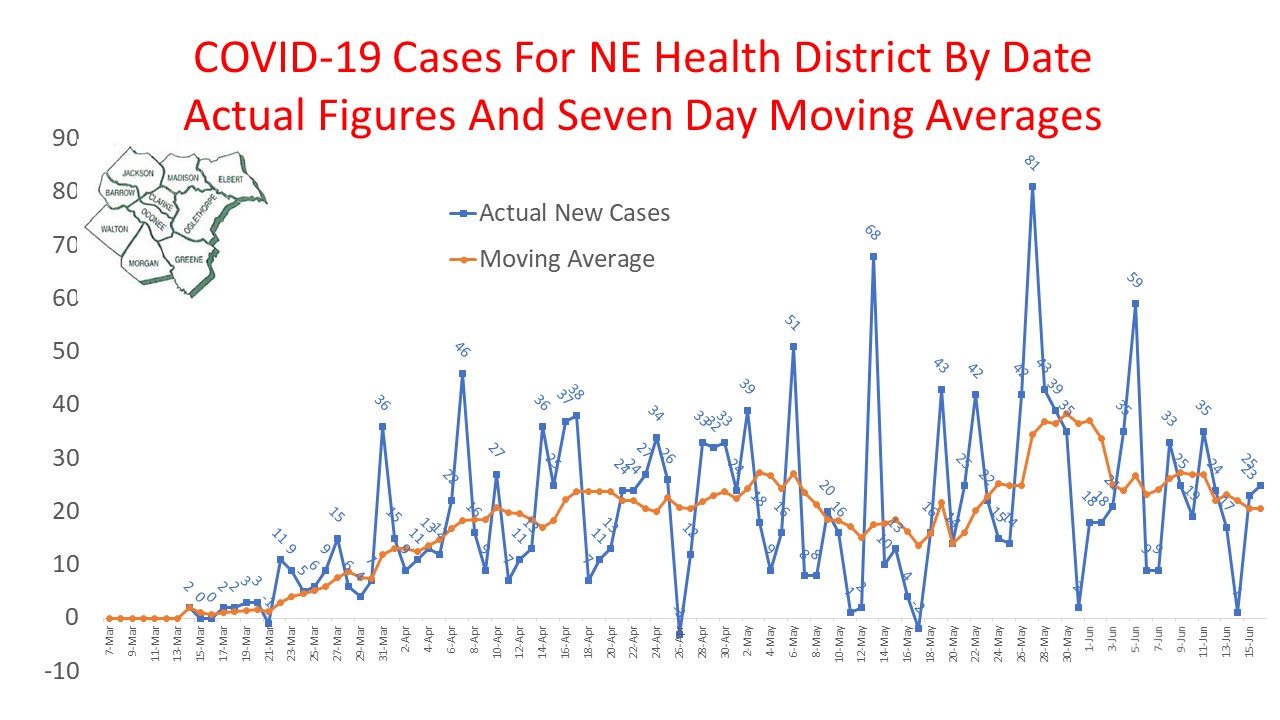
The 10-county Northeast Health District added 25 new confirmed cases of COVID-19 on Tuesday, the same number added a week ago, and the seven-day rolling average of added cases per day remained unchanged at 20.6.
Only two counties–Oconee and Greene–did not add a new case, and the total number of confirmed cases in the District over the three-month run of the pandemic is 1,840.
The Department of Public Health did not add any new deaths with release of the 2:50 p.m. Daily Status Report, and the total number of deaths is 94.
The Department of Community Health Long-Term Care Facility Report on Tuesday also did not report any new COVID-19 deaths in the 23 long-term care facilities in the Northeast Health District with disease among the residents and/or staff.
The Department of Community Health did report two additional cases of COVID Positive Staff–at a facility in Madison County.
The number of active COVID-19 Positive Residents dropped by two to 188 among the 1,512 residents of the 23 facilities.
The Georgia Emergency Management Agency Tuesday Situation Report listed 22 Critical Care Beds available in area hospitals, down from 26 in the report on Monday.
State Data
The Department of Public Health reported, for the state of Georgia as a whole, the addition of 664 new confirmed cases of COVID-19 with the Tuesday Daily Status Report.
The number of added cases is a drop from the 733 added on Monday and from the 752 added on Tuesday of last week, and the seven-day rolling average of added cases declined from 845.3 on Monday to 832.7 on Tuesday.
The overall trend is for added confirmed cases, and the data in Chart 4 below show that the increase is not the result of increased testing.
The dual-axis chart plots across time the number of added tests reported by the Department of Public Health and the number of added cases of confirmed COVID-19. Since the first of the month, Virol Tests are separated out from the total number of tests.
While the lines for tests and for cases run in tandem for a period of time at the beginning of the month, they are moving in opposite directions in the last week.
This is evidence that the growth in cases, at least in that period, is not a result of increased testing but of a real climb in COVID-19 cases in the state.
The Department of Public Health Daily Status Report added 35 new deaths attributed to COVID-19 in the state, and the seven-day average of added deaths declined to 34.9 deaths per day from 40.9 a day earlier.
The Department of Public Health reported that only 19 of those 35 deaths occurred in the last 14 days. It added a death to the data file as far back as April 2.
The Daily Status Report also eliminated five previously reported deaths, so the actual number of added deaths was 40, rather than 35.
The Department of Community Health, in its Tuesday report, listed 439 long-term care facilities in the state with COVID-19 residents and/or staff, up from 434 a day earlier.
The Georgia Emergency Management Agency on Tuesday reported that the number of Confirmed COVID-19 hospitalizations increased by 10 from the day earlier and the number of ventilators in use increased by 22.
The long-term trends in these two measures (in Chart 6), show a flattening of the decline in hospitalizations and a rather consistent use of ventilators going back to May 11, when the data were first included in the Situation Report.
Charts
Charts 1 to 5 below are based on data from the Department of Public Health Daily Status Report and are updated with release of the 2:50 p.m. report on Tuesday.
Charts 1 and 2 are for the 10-county Northeast Health District.
Charts 4 through 6 are for the whole state of Georgia.
Chart 6 is based on data from the Georgia Emergency Management Agency Situation Report and is updated with the release of the Tuesday report.
 |
| Chart 1 (Click To Enlarge) |
 |
| Chart 2 (Click To Enlarge) |
 |
| Chart 3 (Click To Enlarge) |
 |
| Chart 4 (Click To Enlarge) |
 |
| Chart 5 (Click To Enlarge) |
 |
| Chart 6 (Click To Enlarge) |
No comments:
Post a Comment